Self-hosted AWS observability, in one Terraform stack per environment.
Prometheus + Grafana + a CloudWatch exporter + a Cost Explorer exporter on Fargate, fronted by Cloudflare Tunnel + Cloudflare Access. No public IP, no inbound firewall rule, no static AWS credentials in CI. Dashboards and alert rules ship as code from the repo and auto-provision on container start.
1. Infrastructure as code, per environment
Approach. A single Terraform root deploys the whole stack onto an existing AWS ECS cluster (or provisions a dedicated cluster if asked). Backend config is supplied at init time via -backend-config so the same code targets any AWS account; one S3 state file per environment, with native S3 conditional-write locking (no DynamoDB lock table). Container images pinned to specific versions in var.container_images.
What's running
- Five ECS Fargate services in private subnets:
prometheus,grafana,yace(CloudWatch exporter),cost-exporter(Cost Explorer exporter + forecast sidecar),cloudflared(outbound tunnel). - EFS-backed state for Prometheus TSDB and Grafana SQLite. Single-instance services with hard cutover (
min_healthy% = 0,max% = 100) so a rolling deploy can't ever run two tasks against the same EFS volume. - Cloud Map private DNS namespace (default
agent-obs.local) — Grafana finds Prometheus atprometheus.agent-obs.local:9090; Prometheus DNS-discovers yace / cost-exporter without any hard-coded IPs. - Shared IAM execution role in the root module; each service that needs AWS API access defines its own task role in
modules/<svc>/iam.tf.
Demonstrable artifacts
- terraform/ — single root, all modules underneath
- terraform/main.tf — module wiring + cross-service security-group ingress rules
- terraform/variables.tf — full variable schema with validation rules
- envs/EXAMPLE.tfvars — per-env template (real env files are gitignored)
- envs/EXAMPLE.backend.hcl — backend template (S3
use_lockfile = true, no DynamoDB)
2. AWS metrics & cost in one timeseries store
Approach. Two purpose-built exporters write to one Prometheus. yace (Yet Another CloudWatch Exporter) covers operational metrics — ECS, RDS, ALB, NLB, ElastiCache, optional AWS/Billing. cost_explorer_exporter + a Python forecast sidecar hit the Cost Explorer API for richer cost data than CloudWatch can provide. Both register with Cloud Map; Prometheus DNS-discovers them.
What's scraped
| Exporter | Source | Surfaces |
|---|---|---|
yace | CloudWatch (cloudwatch:GetMetricData) | ECS CPU/mem, ECS/ContainerInsights task counts, RDS CPU/conns/freeable-mem/IOPS, ALB p50/p95/p99 + 5xx + healthy-host, NLB flow + healthy-host, ElastiCache CPU/mem/hits/misses/network |
yace | CloudWatch AWS/Billing (us-east-1) | Estimated charges total + per-service (backup signal — Cost Explorer is the primary) |
cost-exporter | Cost Explorer ce:GetCostAndUsage | MTD unblended cost by service, credits applied, daily-granularity trend |
cost-forecast sidecar | Cost Explorer ce:GetCostForecast | End-of-month forecast + 30-day forecast with 80% prediction interval, UNBLENDED & AMORTIZED |
Cost Explorer is billed at $0.01 per call — polling intervals default to 8h (usage) and 24h (forecast) so the API spend stays below 10 cents/month.
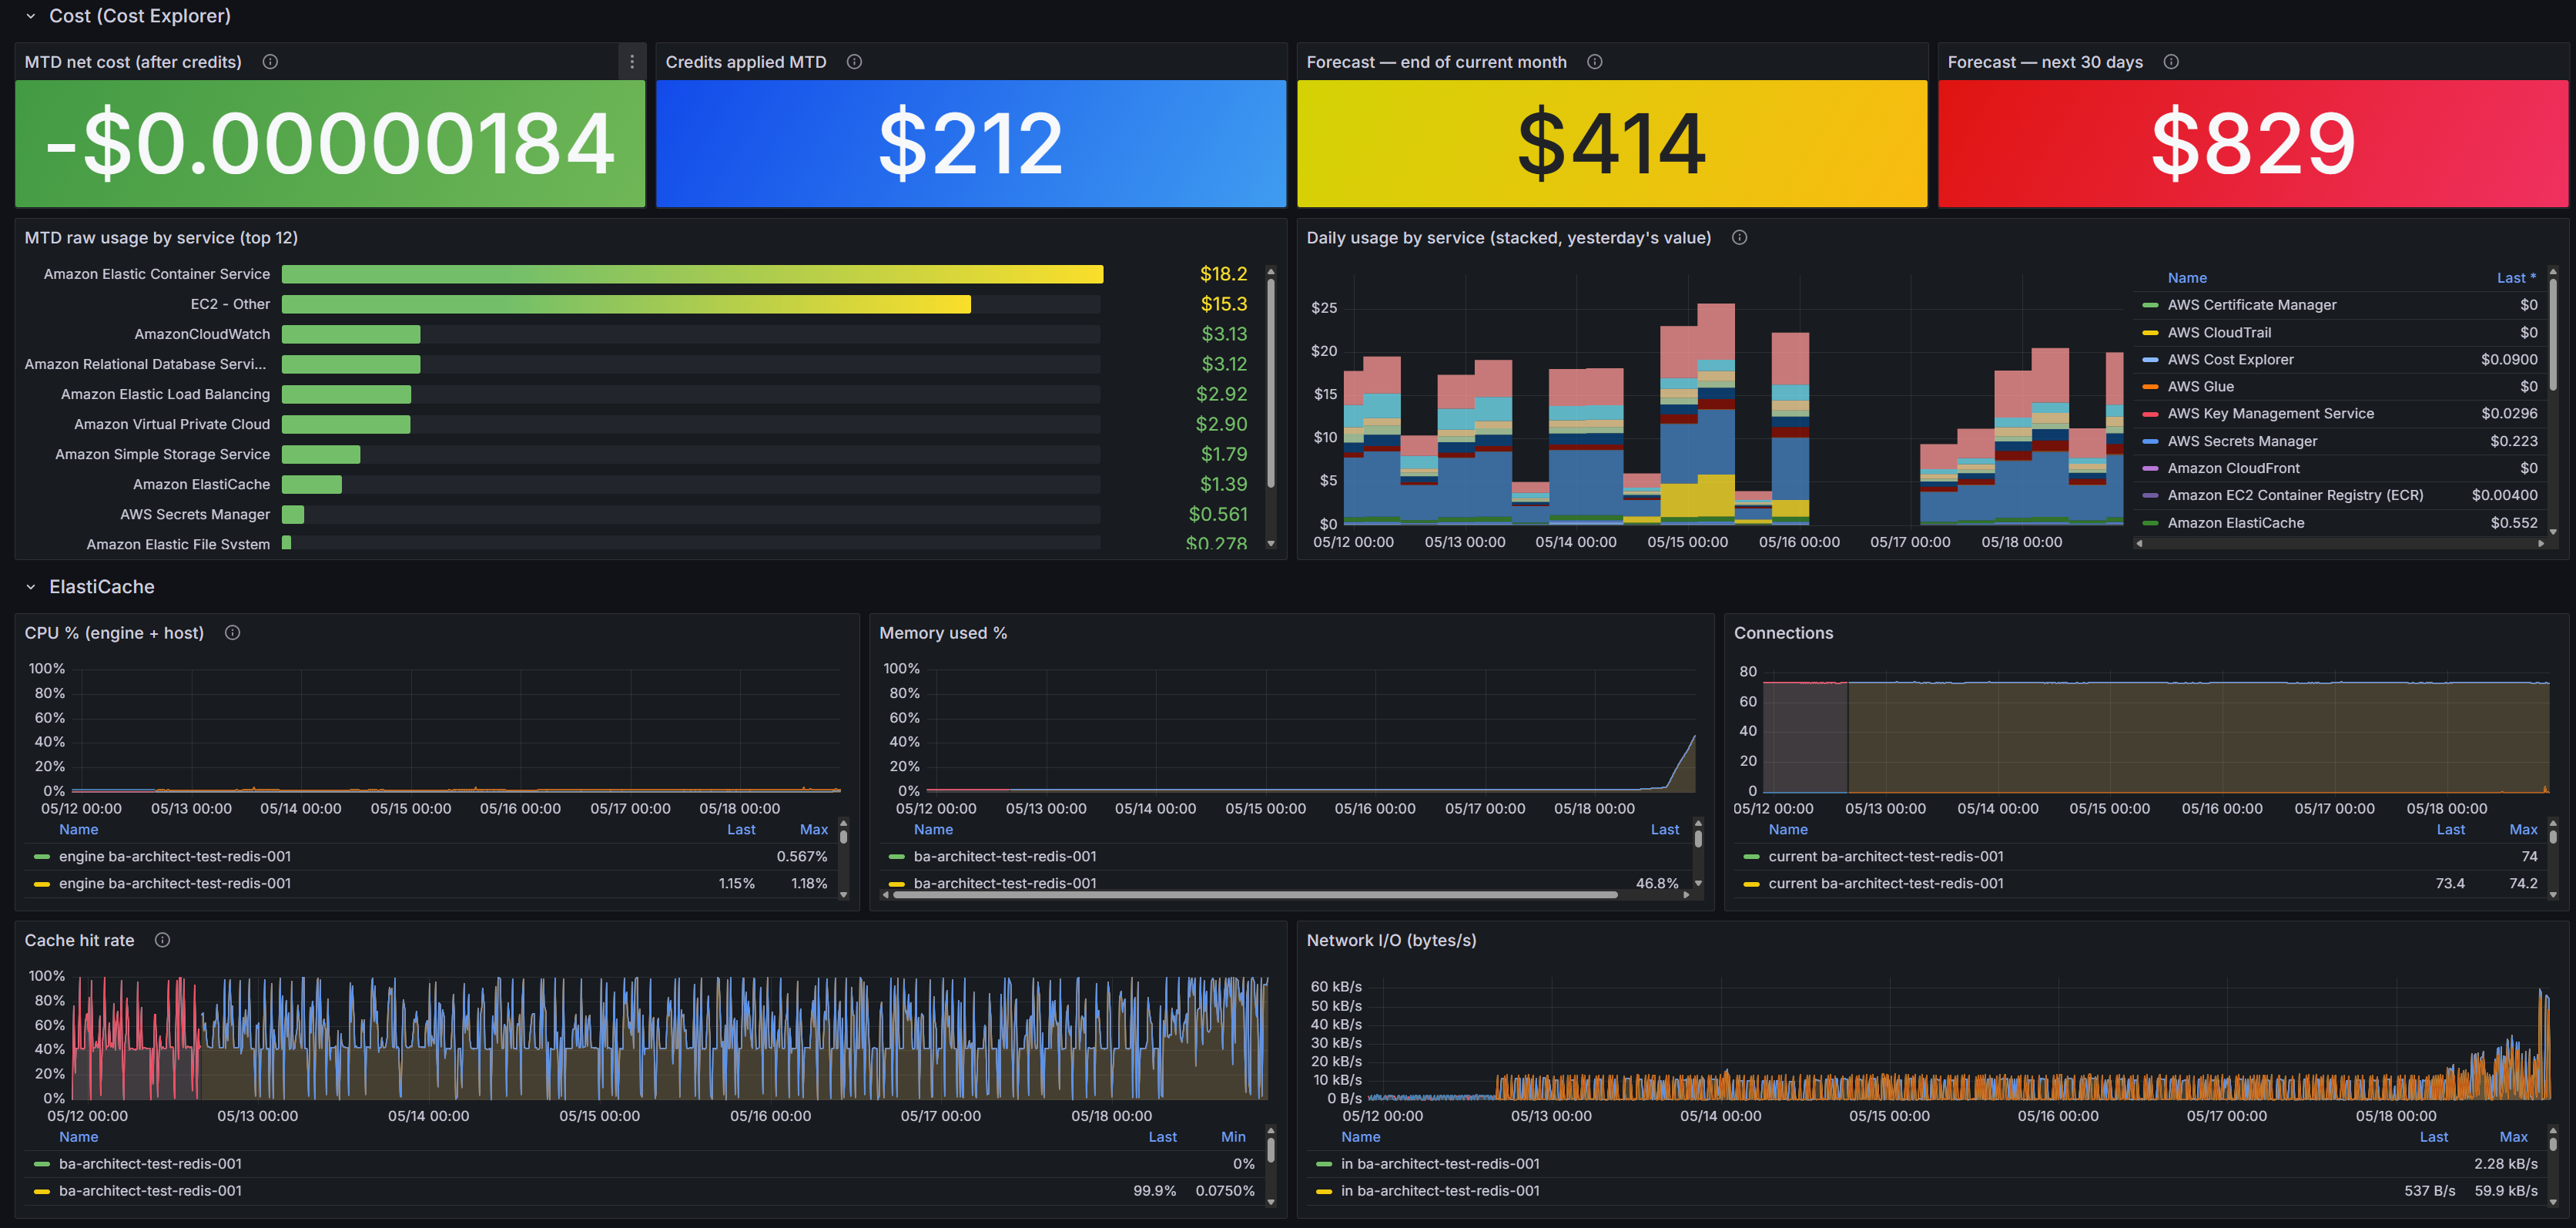
ce:GetCostForecast, sourced from the aws_cost_forecast_usd{period,metric} series.Demonstrable artifacts
- terraform/modules/yace/ — CloudWatch exporter task definition + yace config inlined as a heredoc
- terraform/modules/cost_explorer_exporter/ — exporter + forecast sidecar (Python script delivered via env var)
- terraform/modules/prometheus/ — TSDB + inline
prometheus.ymlwith DNS service discovery jobs
3. Dashboards & alerts as code
Approach. Drop a JSON file in dashboards/; Terraform discovers it at plan time via fileset(), ships it as an env var on the Grafana container, and the entrypoint writes it to /tmp/provisioning/dashboards/ where Grafana auto-loads it on startup. Five Grafana unified-alerting rules ship the same way, inlined in the Grafana module. No custom image build, no UI clicks to reproduce a deploy.
What's running
- One single-pane-of-glass dashboard (
aws-single-pane-of-glass.json) — ECS service health, RDS, ALB/NLB latency & 5xx, ElastiCache, MTD cost by service, end-of-month forecast vs budget threshold. - UI edits allowed by default (
dashboards_allow_ui_updates = true) — edit live, export the JSON, save it todashboards/,terraform apply. Set the flag tofalseto make dashboards strictly read-only. - 5 built-in alert rules in the
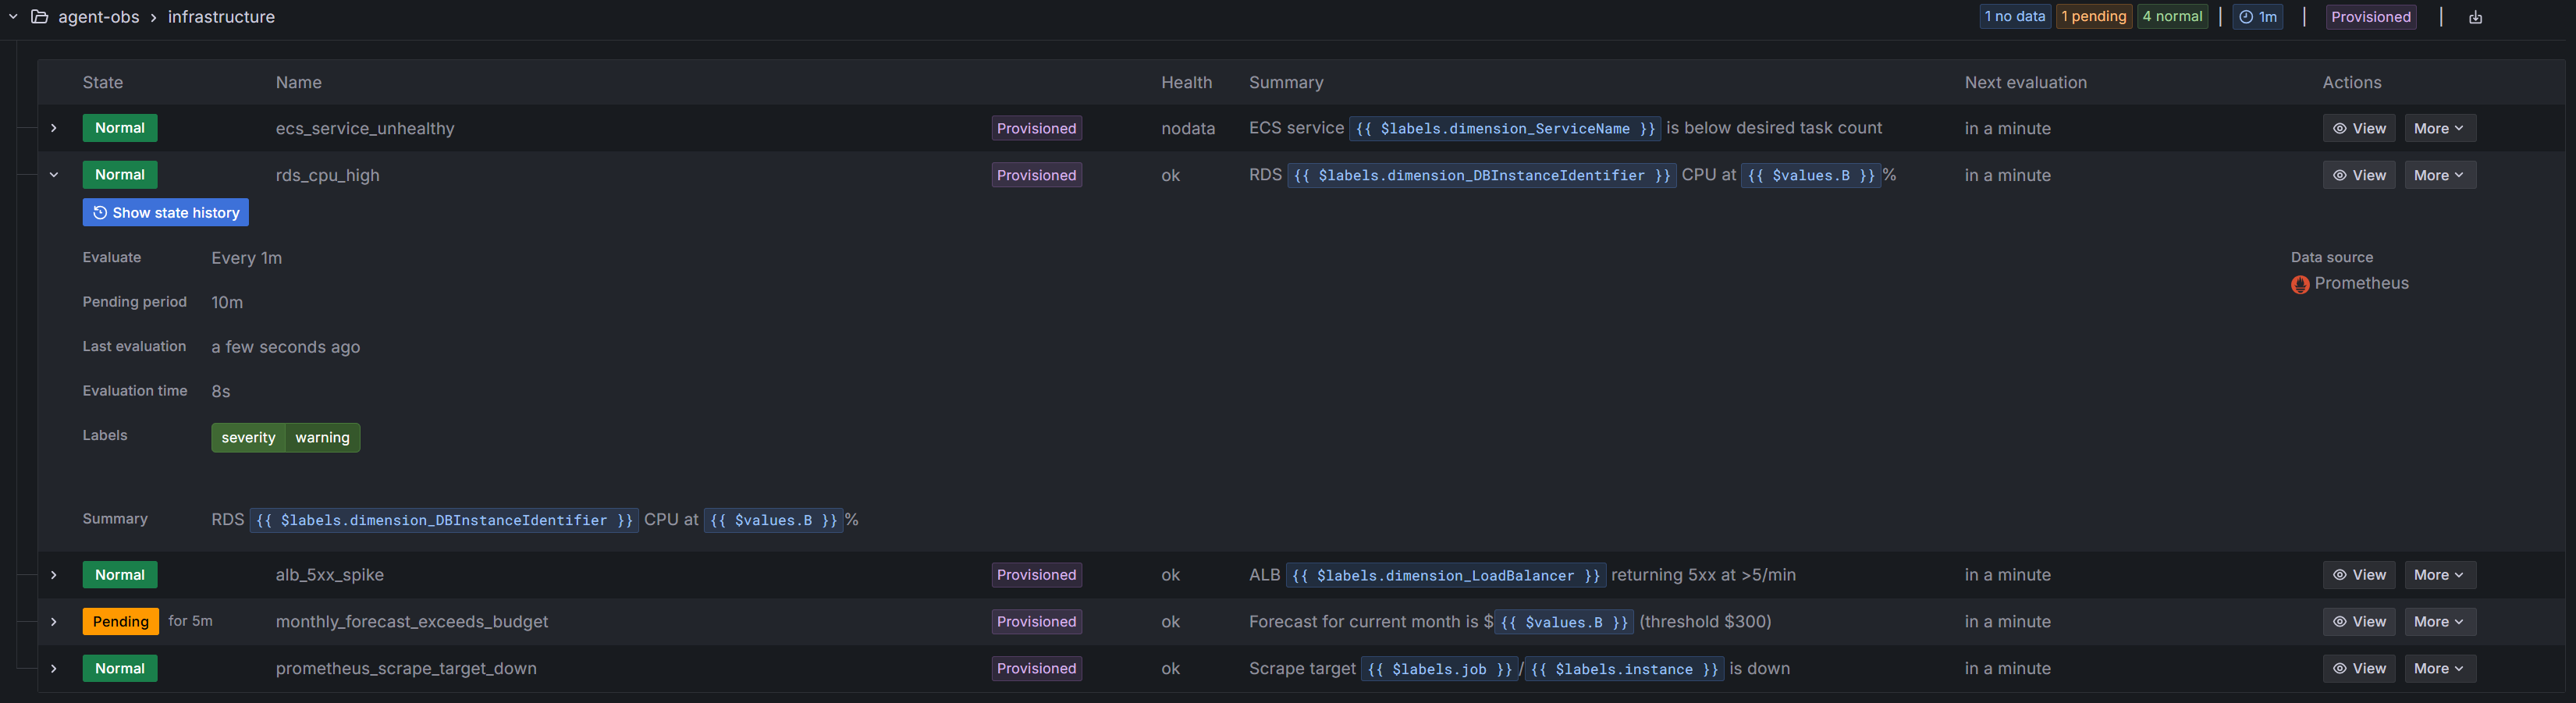
agent-obs/infrastructuregroup, evaluating every 1m.
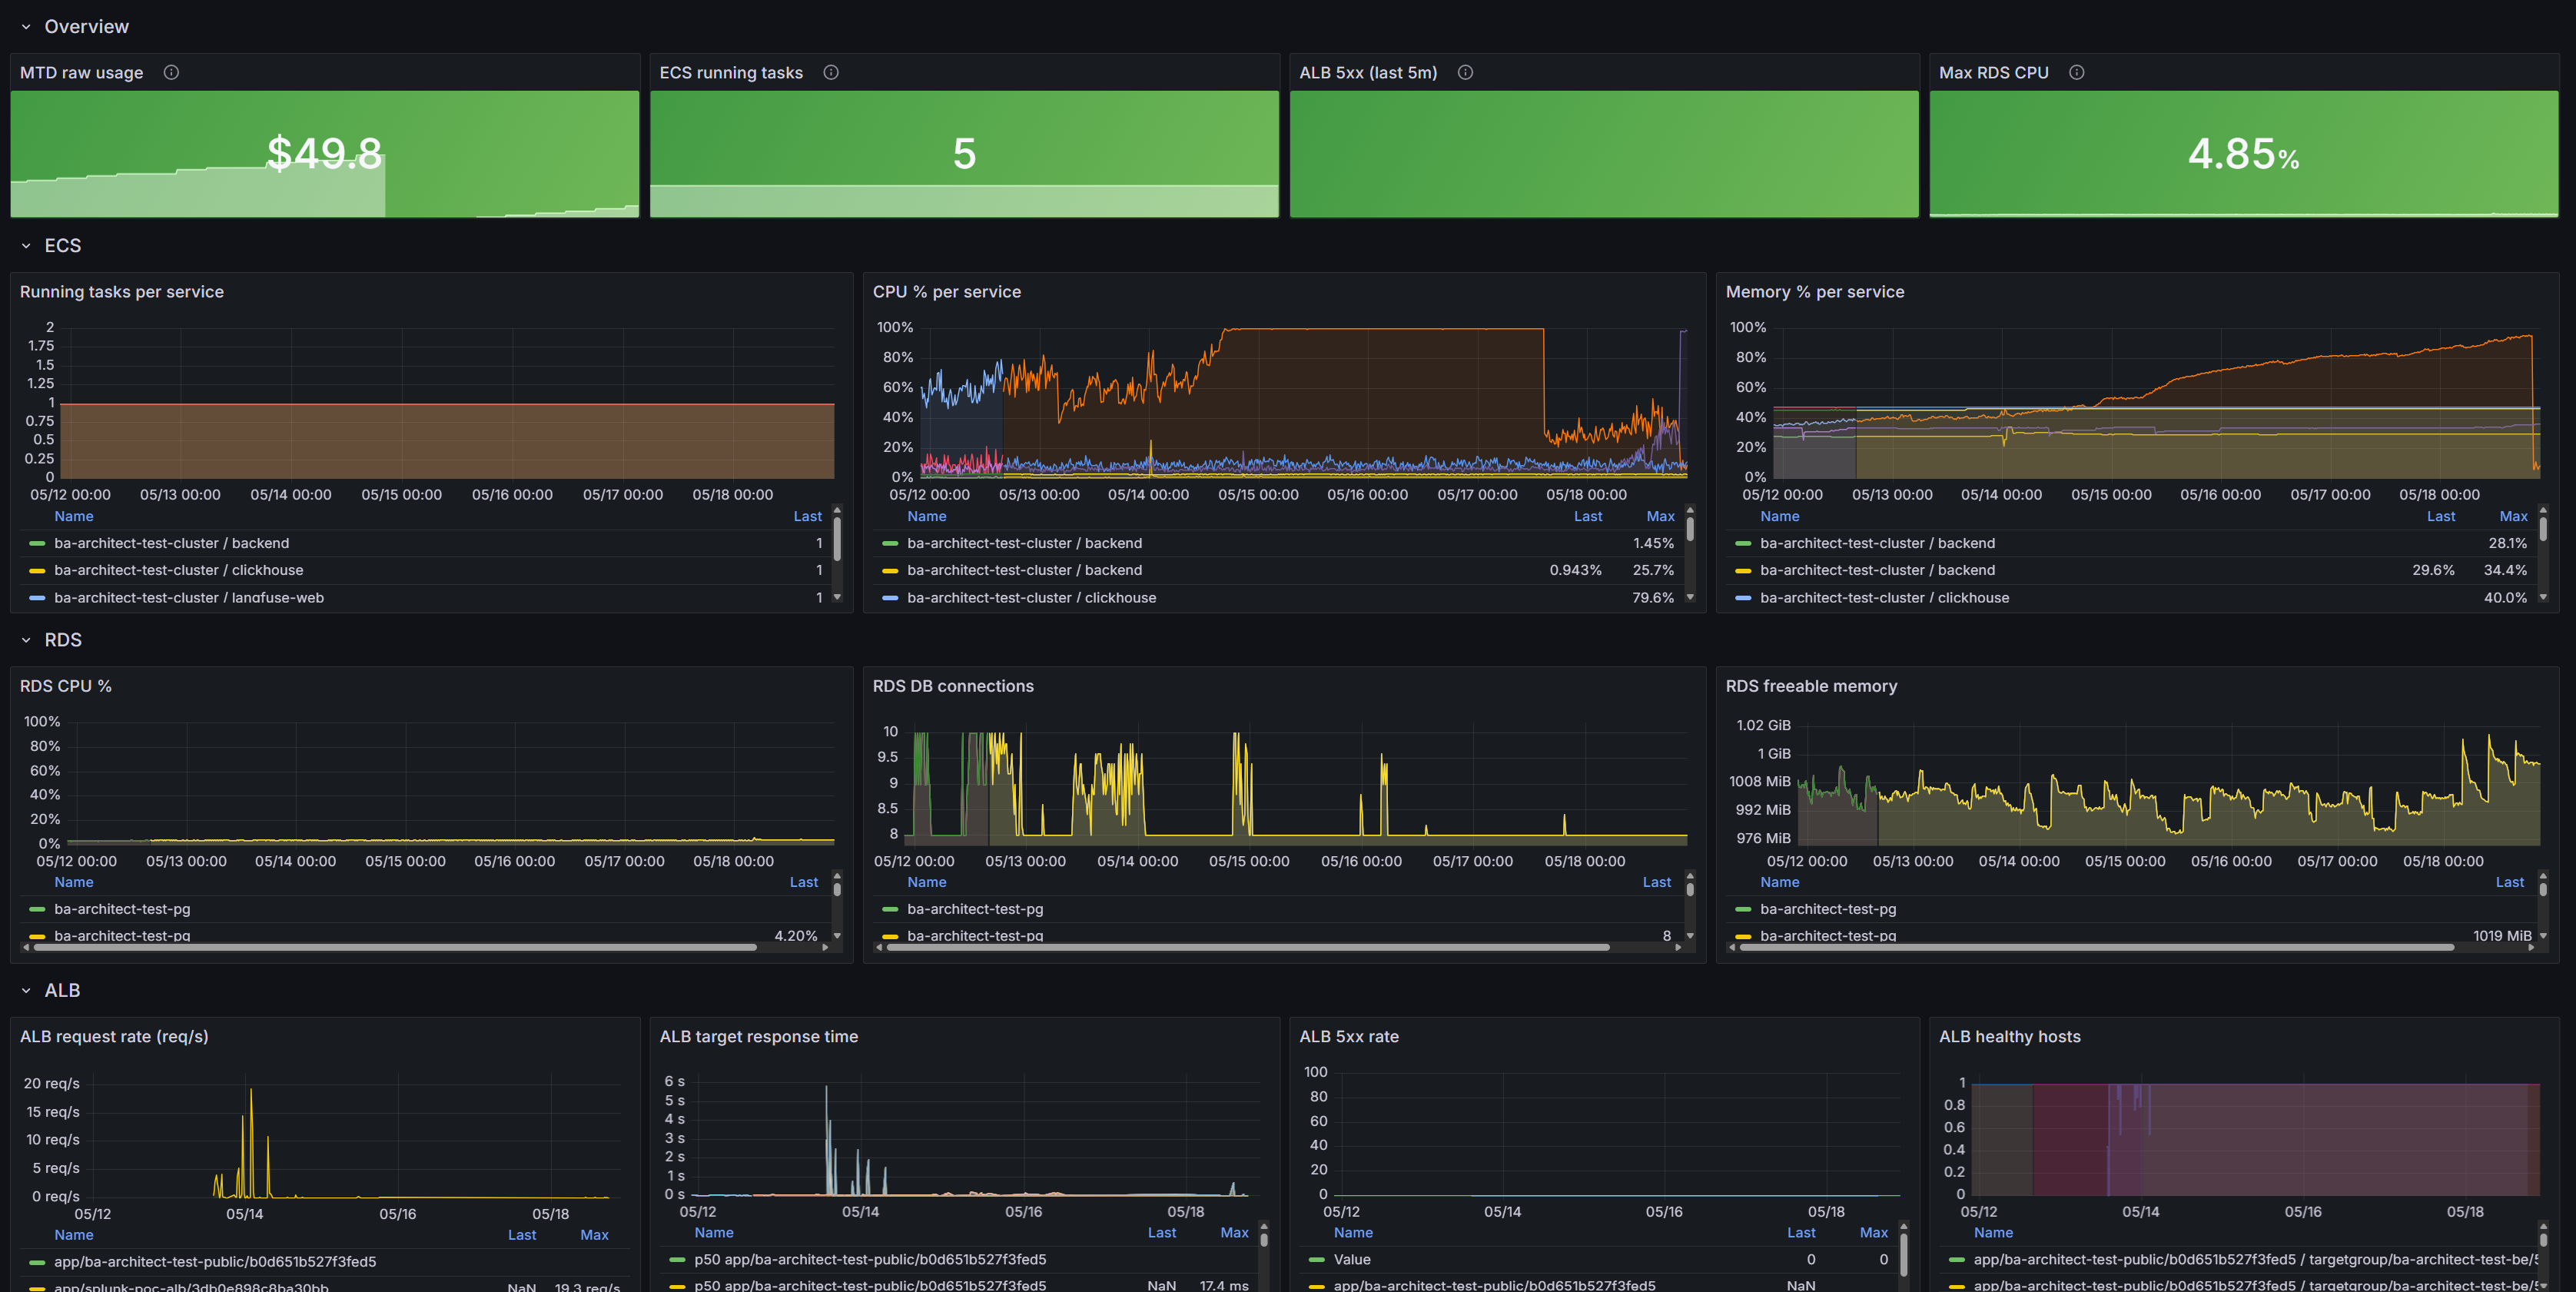
/dashboards/aws-single-pane-of-glass — every panel sourced from a single Prometheus datasource Grafana wired up on its own at task start.Alert rules
| Rule | Fires when | Severity |
|---|---|---|
ecs_service_unhealthy | running tasks < desired for 5m | critical |
rds_cpu_high | RDS CPU > 80% for 10m | warning |
alb_5xx_spike | ALB 5xx rate > 5/min for 5m | warning |
monthly_forecast_exceeds_budget | end-of-month forecast > alert_monthly_budget_usd for 1h | info |
prometheus_scrape_target_down | up == 0 for 2m | warning |
Rules evaluate but won't notify until a contact point is configured in the Grafana UI — each option (Slack webhook, SMTP, PagerDuty key) is an env-specific secret, so we deliberately don't bake one into Terraform.
terraform/modules/grafana/main.tf, no UI clicks to reproduce.Demonstrable artifacts
- dashboards/ — JSON files, one per dashboard
- terraform/locals.tf —
fileset()discovery wiring - terraform/modules/grafana/main.tf — alert rule YAML + the entrypoint that materialises everything to
/tmp/provisioning/
4. Zero-trust browser access — no public IP, no inbound rule
Approach. A cloudflared Fargate task in the VPC maintains a persistent outbound tunnel to the Cloudflare edge. Browser traffic hits the public Grafana hostname, Cloudflare Access challenges the request through the configured SSO provider, then the request rides the tunnel back to Grafana on its private IP. No public ALB, no IGW route for Grafana, no inbound port 443 exposed anywhere on the AWS side.

cloudflared → Grafana on a private IP. No public ALB, no IGW route for Grafana, no inbound port 443 exposed on AWS.What's running
- Cloudflare Tunnel created by Terraform via the Cloudflare provider; tunnel token captured by data source and written to AWS Secrets Manager;
cloudflaredreadsTUNNEL_TOKENfrom there at task start. - Cloudflare Access self-hosted application bound to the Grafana hostname, allow-policy includes the configured email domains and/or specific emails.
- DNS record (CNAME →
<tunnel-id>.cfargotunnel.com, proxied) created by Terraform. - Cross-service security groups — explicit ingress rules at the root: Prometheus → yace, Prometheus → cost-exporter, Grafana → Prometheus, cloudflared → Grafana. Egress is unrestricted, ingress is exact.
Demonstrable artifacts
- terraform/modules/cloudflared/ — tunnel, Access app/policy, DNS record, Secrets Manager wiring
- main.tf — cross-service SG ingress rules (lives at the root, not inside modules, to avoid sibling-module cycles)
- Live Grafana — Cloudflare Access SSO landing page (allowlisted emails only)
5. CI/CD via GitHub Actions + OIDC — no static AWS keys
Approach. One workflow, two jobs. plan runs on every PR touching terraform/** or dashboards/**; apply runs only on push to main, gated behind a test GitHub Environment that can require reviewer approval. AWS auth is OIDC — a federated trust between token.actions.githubusercontent.com and an IAM role created by this same Terraform stack. Zero static credentials in GitHub Secrets on the AWS side.
Pipeline
.github/workflows/terraform.yml
- materialise env files —
envs/test.tfvarsrendered from theTFVARS_TESTrepository variable,envs/test.backend.hclemitted by a heredoc inside the workflow itself (single source of truth, no drift) - aws-actions/configure-aws-credentials — assumes
AWS_DEPLOY_ROLE_ARNvia OIDC, no static keys - terraform init with
-backend-config=../envs/test.backend.hcl - terraform validate
- terraform plan — uploaded as artifact on PRs for review
- terraform apply -auto-approve tfplan — push-to-main only, behind the
testenvironment gate
The Cloudflare side still uses an API token (CLOUDFLARE_API_TOKEN in GitHub Secrets) — Cloudflare doesn't offer GitHub OIDC federation yet, so it's the one static credential the workflow can't avoid.
Bootstrap
- First apply runs locally with developer AWS creds — provisions the IAM OIDC provider (skippable if your account already has one) and the GitHub deploy role.
- Capture the role ARN from
terraform output github_actions_role_arn. - GitHub repo settings — set
AWS_DEPLOY_ROLE_ARNandTFVARS_TESTas repository variables,CLOUDFLARE_API_TOKENas a repository secret. - Future deploys run from CI — PR opens, plan attached as artifact, merge to
mainruns apply.
Demonstrable artifacts
- .github/workflows/terraform.yml — full workflow
- terraform/iam_github_oidc.tf — IAM role + trust policy for GitHub OIDC
- GitHub Actions runs — green plan + apply history
Capability scorecard
| Capability | Status | Notes |
|---|---|---|
| Infrastructure as code, per env | Fully demonstrated | One Terraform root, S3 state w/ native locking, container images pinned, EFS-backed Prom & Grafana |
| AWS metrics & cost collection | Fully demonstrated | CloudWatch via yace (6 namespaces) + Cost Explorer with forecast sidecar, all into one Prometheus |
| Dashboards & alerts as code | Fully demonstrated | 1 dashboard + 5 alert rules auto-provisioned on container start, no custom image required |
| Zero-trust browser access | Fully demonstrated | Cloudflare Tunnel + Access SSO, 0 public IPs, 0 inbound firewall rules, tunnel token in Secrets Manager |
| CI/CD via OIDC | Fully demonstrated | Plan on PR, apply on merge, AWS auth via OIDC; Cloudflare API token is the one unavoidable static cred |